
Case Study · The Live View · Product: Lens
“Where does the business stand today, by brand and branch?”
For a Dubai-based multi-brand F&B group, the answer used to be a spreadsheet somebody finished two weeks after the month ended. Every brand- and branch-level view was rebuilt by hand; each new cut of the numbers waited on a specialist. Now it is permanently current: consolidated statements straight from Business Central, re-sliced in a click, with no new report to build and no specialist to wait for.
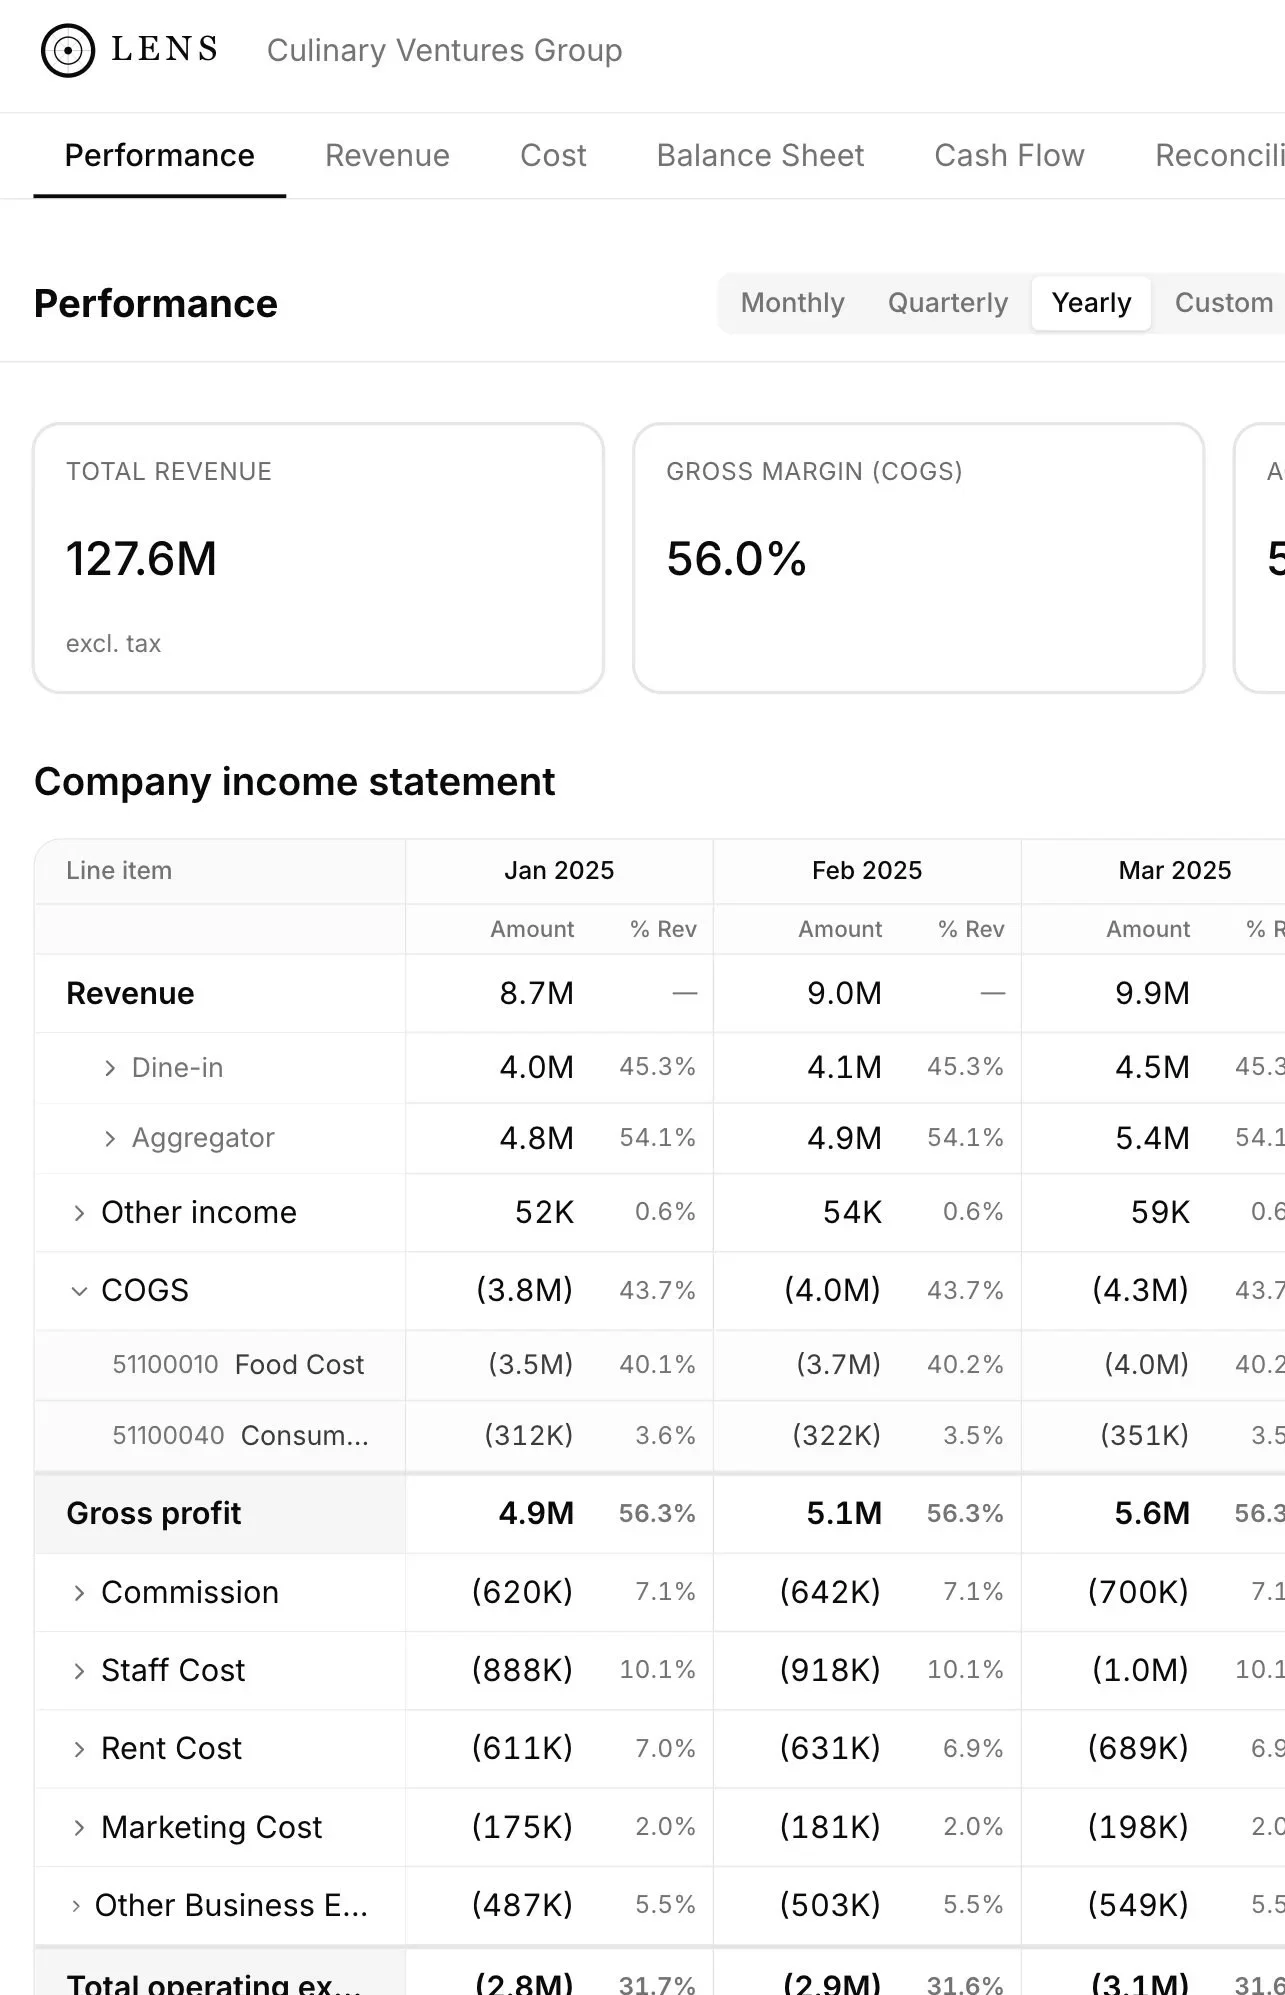
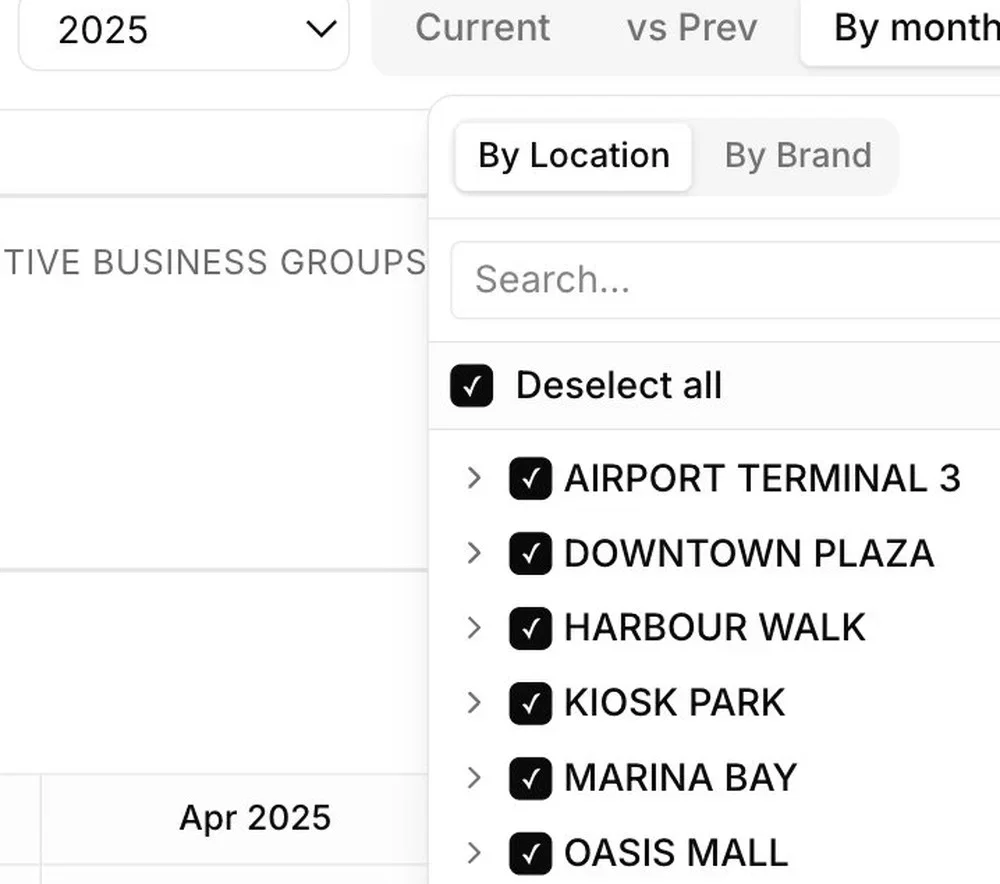
Any period, any slice
- Monthly, quarterly, yearly or a custom range; current, vs prior, or month-by-month across the year
- Slice by business group, location or individual outlet
- Income statement, balance sheet and top items all follow the same filters
- Compare to last year side by side; export any view to Excel in one click
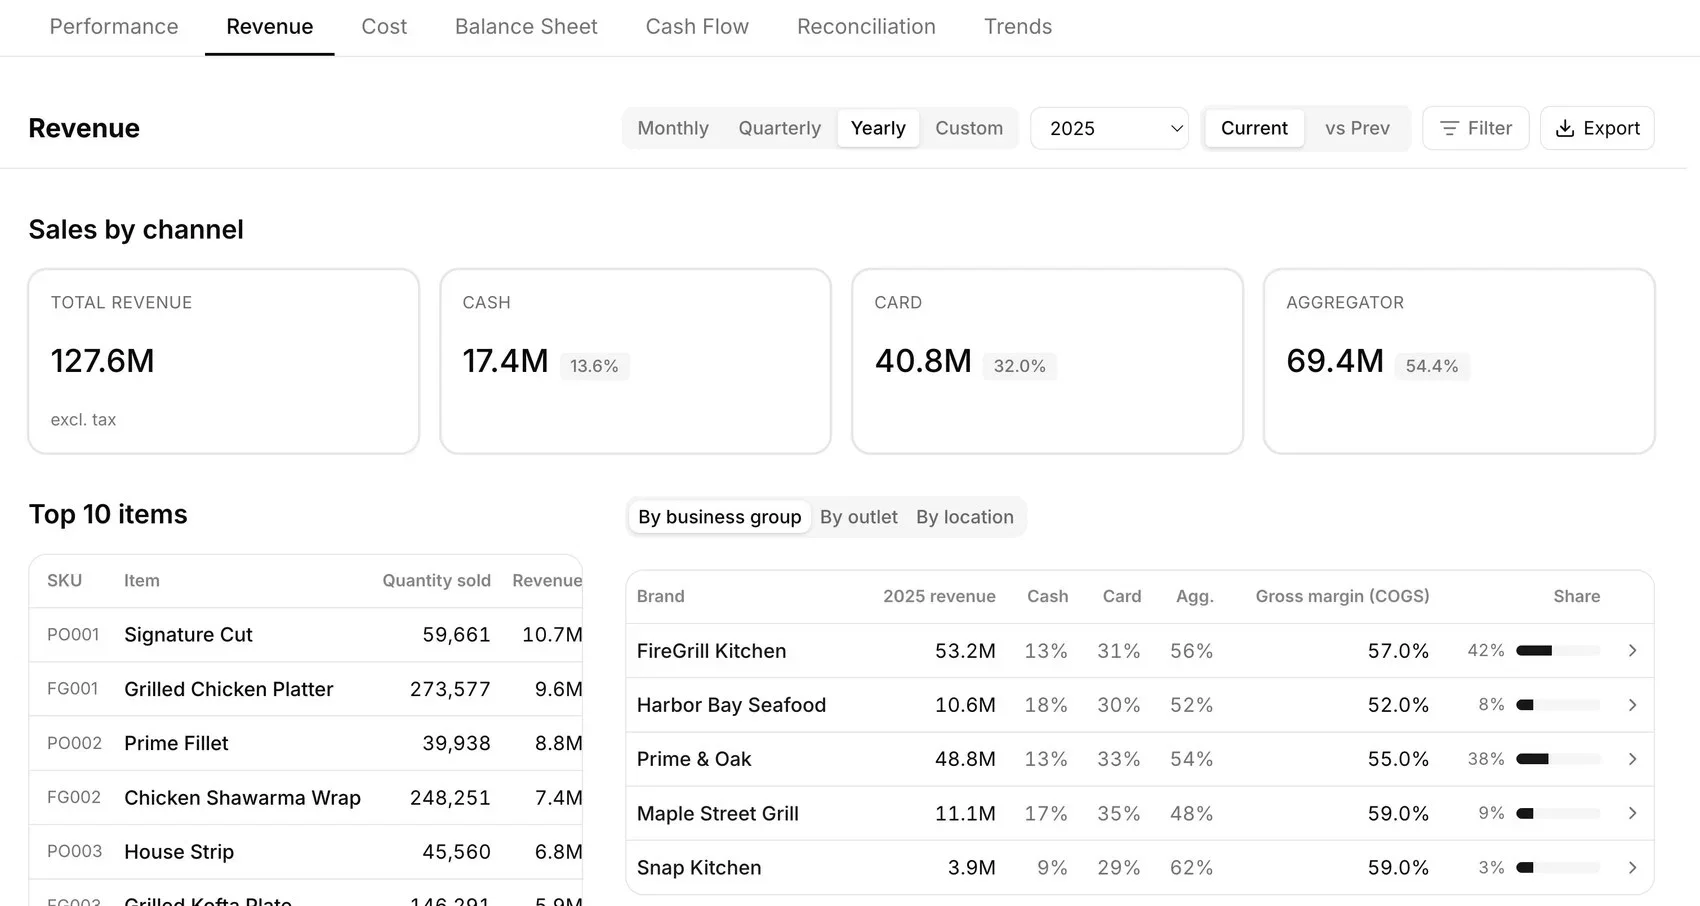
See where the revenue comes from
The sales picture the team would otherwise stitch together by hand: channel mix, top sellers and per-brand margin and share, on one screen, driven by the same filters.
Everyone sees exactly their level
With ~100 outlets, distributing the numbers used to be its own monthly job. Access is role based instead: a regional manager sees their branches, a brand head sees their brand, finance sees it all — without a separate report built and maintained for every person.
- Grant access by report and feature
- By brand: one brand, several, or all; by location and individual outlet
- Role-based, governed, changeable in seconds
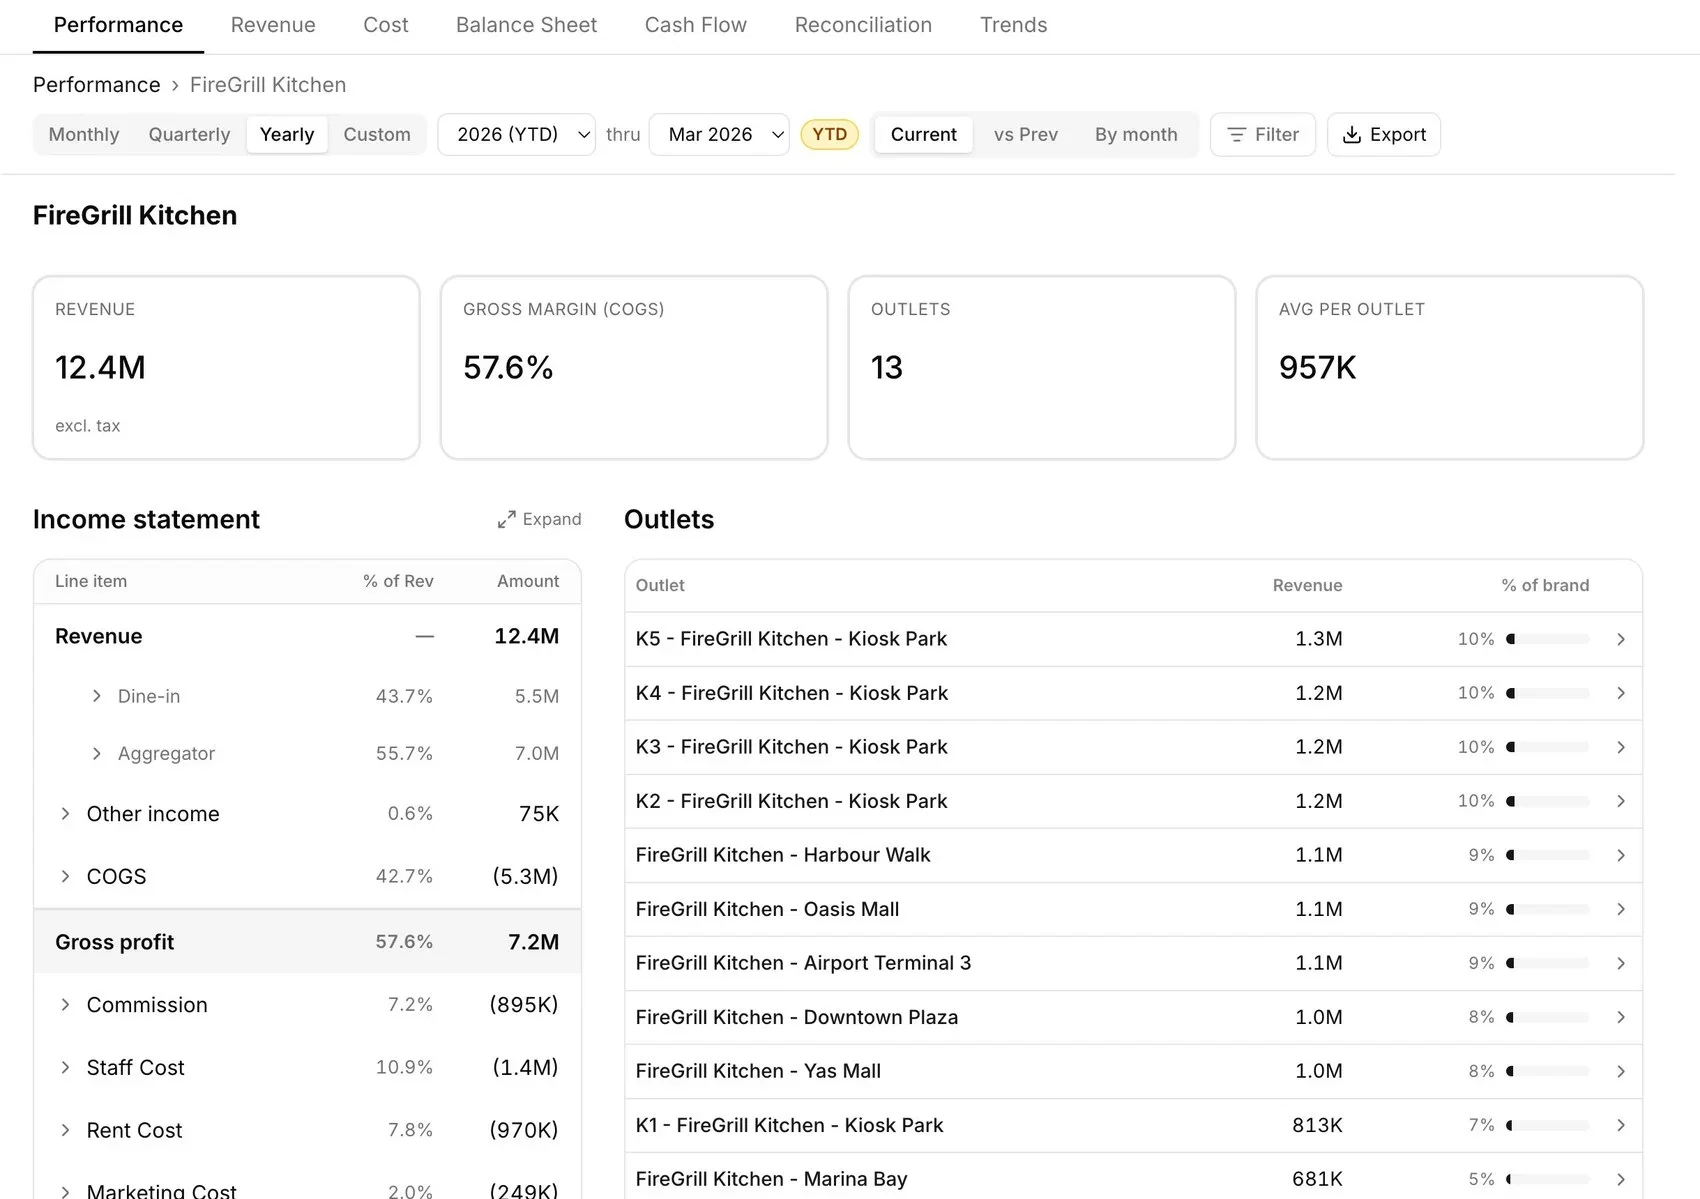
When a number moves, the cause is a few clicks away
From group to brand to location to the one outlet driving it, instead of a week in spreadsheets.
- Open any brand to its full income statement
- Rank outlets to find the one moving the number
- Margin and cost lines follow all the way down
- A per-entity balance check, so the numbers tie
The same group also fixed accounts payable
The other half of the engagement: an AP engine that learns the company's own accounting rules and posts every vendor invoice coded, allocated and reconciled.
Read the Xtract case study →Secure, and in Your Control
Sign in with Microsoft·Read-only, never writes to Business Central·Runs in your Azure region·Live sync, unlimited users
See it on live numbers. Book a 30-minute guided demo.
Built on the finance system you already own.
Contact info@zfenselabs.comFigures shown for illustration.