Moving Average Crossover Strategy
A deep dive into one of the most popular technical trading strategies, backed by real market data and performance analysis
The Psychology Behind Moving Averages
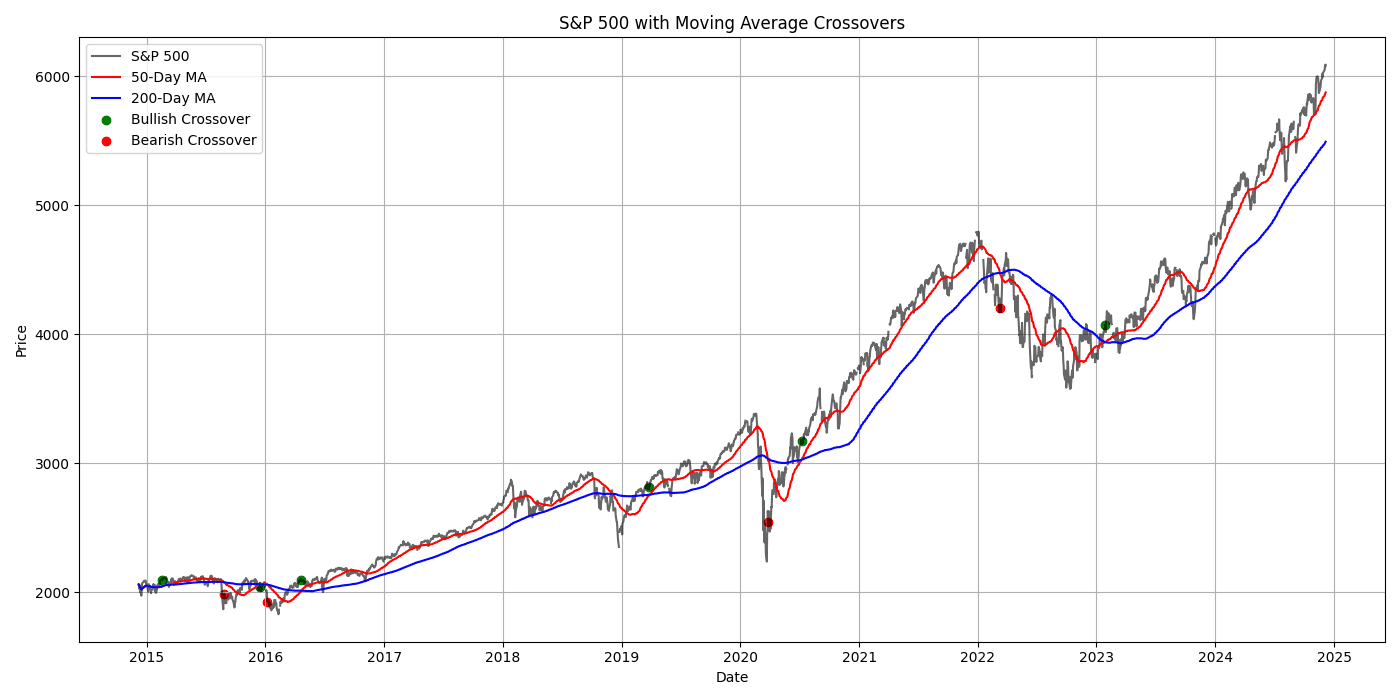
Moving averages have endured as reliable technical indicators because they reflect collective market psychology. The 50-day MA represents intermediate-term sentiment, while the 200-day MA captures long-term market trends. When these averages cross, they signal potential shifts in market momentum.

S&P 500 with 50 & 200-day moving averages (2015-2024): Note the 6 bearish and 6 bullish crossovers, each marking significant trend changes
From Theory to Practice: MSFT Case Study
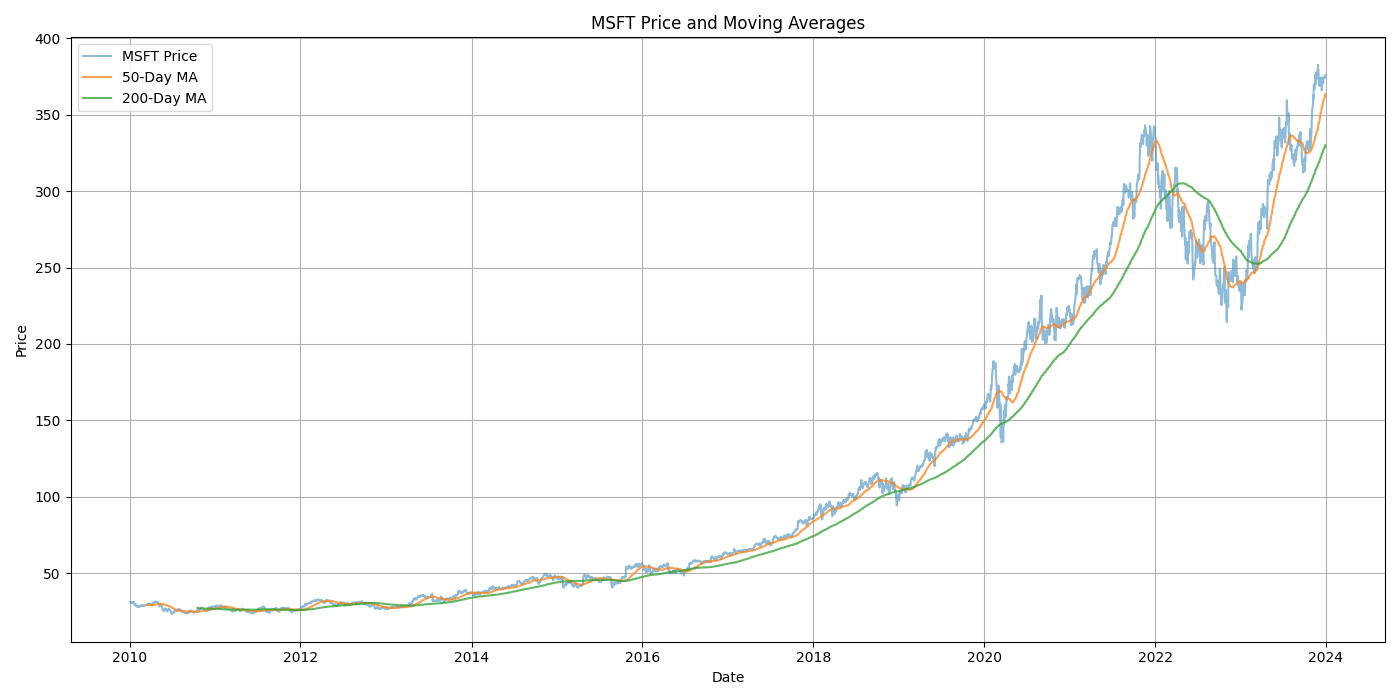
To understand how this strategy performs in real markets, we analyzed its application to Microsoft stock over a comprehensive 14-year period (2010-2024). This period includes multiple market cycles, providing valuable insights into the strategy's behavior in different market conditions.

Performance Insights
Annual Return
10.18%
Max Drawdown
-36.44%
Sharpe Ratio
0.40
Win Rate
48.65%
The strategy's performance tells an interesting story about market timing. While the 10.18% annual return demonstrates its ability to capture major trends, the 48.65% win rate reveals that successful trend following isn't about being right more often – it's about capturing larger moves when you are right.
The relatively high maximum drawdown of 36.44% and moderate Sharpe ratio of 0.40 remind us that trend following requires patience and strong risk management. These metrics reflect the strategy's tendency to experience periods of whipsaws during range-bound markets.
Building Your Strategy
Our platform allows you to implement this strategy with customizable parameters:
Entry Rules
- • Buy when 50-day MA crosses above 200-day MA
- • Sell when 50-day MA crosses below 200-day MA
- • Optional volume confirmation filters
Risk Management
- • Position sizing based on volatility
- • Stop-loss placement strategies
- • Portfolio exposure limits
Key Insights
1. The strategy excels at capturing major market trends but requires discipline during choppy periods
2. Lower win rate but positive returns highlight the importance of proper position sizing
3. Best suited for liquid markets with strong trending characteristics
⚠️ Past performance does not guarantee future results. The strategy's significant drawdown potential highlights the importance of proper risk management and position sizing.