
Worked example · Business Central reconciliation
Every brand agreed to the fils, the dirham's cent. The totals were AED 292,808.81 apart.
By Avradip Mandal·
Ember & Oud is an invented restaurant group with a realistic ledger, so the mechanics are real and the books are nobody's. Every figure is illustrative.
Ember & Oud runs six brands out of a single central kitchen. Oak & Marble is the premium grill; Blaze Wing is the volume business; Clawpoint, Rolling Twentytwo, Frankly Dogs and Verde Blends fill out the portfolio. Fourteen restaurants, one finance team, all on Business Central. A growth investor's diligence list arrived on Tuesday, and item four asked for revenue by brand, year to date, tied to the general ledger. Two people answered it, because two people had the access. Amira runs finance for the group and works in Lens; she built the brand table for the board pack. Karim is the group's Business Central partner, has maintained the ledger since go-live, and has no Lens login. The CFO asked him for the ledger-side schedule. Neither knew the other had been asked.
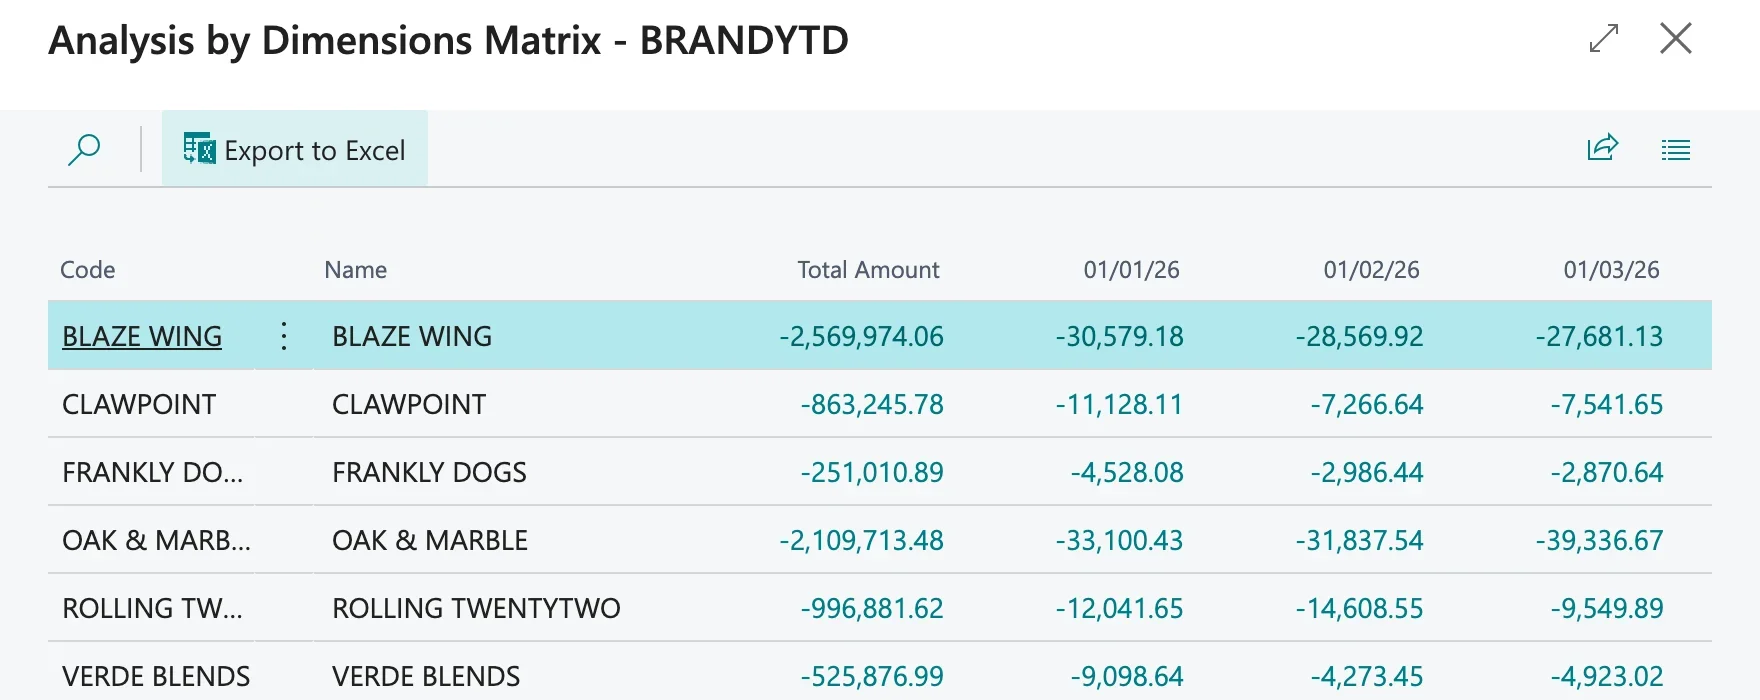
Both schedules landed in the data room on Thursday. Line by line they were identical: Blaze Wing 2,569,974.06, Oak & Marble 2,109,713.48, and so on down all six brands, to the fils, the dirham's cent, produced by two people who had not spoken. Then the totals disagreed by AED 292,808.81, and neither schedule carried an obvious mistake.
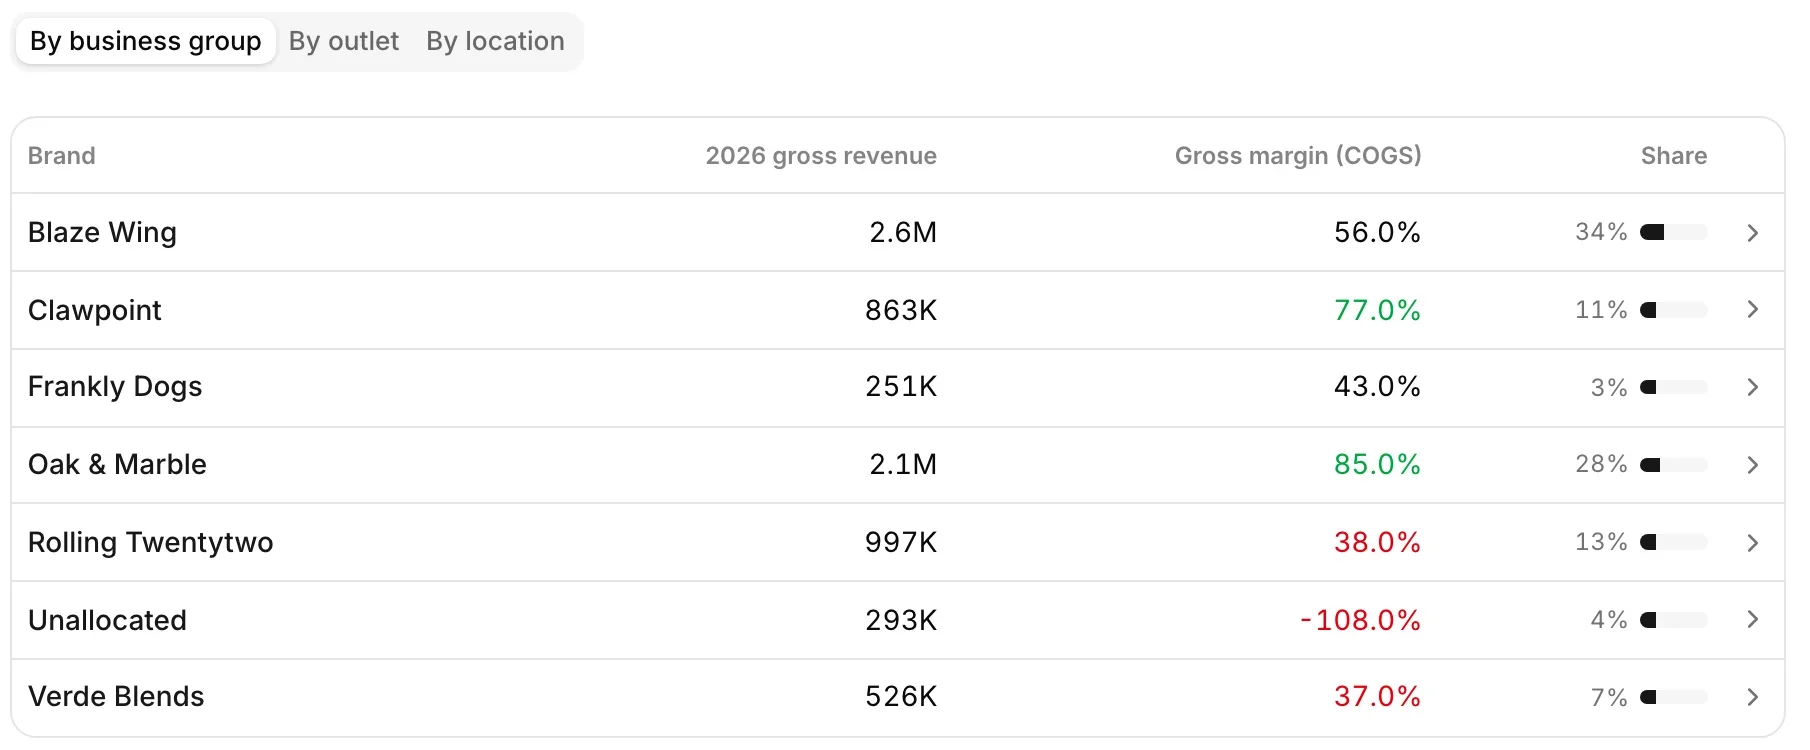
AED 292,808.81 is too large to be rounding. Timing is ruled out too, because both schedules were run against the same closed period in the same company. The gap is not spread across the brands, since every brand line agrees exactly, which eliminates a rate, a currency conversion and a competing definition of revenue. Whatever it is, it is one thing, sitting somewhere only one of the two views can see.
The gap had to be somewhere neither of them had looked
The question that went back to both of them
Same ledger, same period, six brands agreeing exactly. Where did AED 292,808.81 come from, and which schedule belonged in the data room?
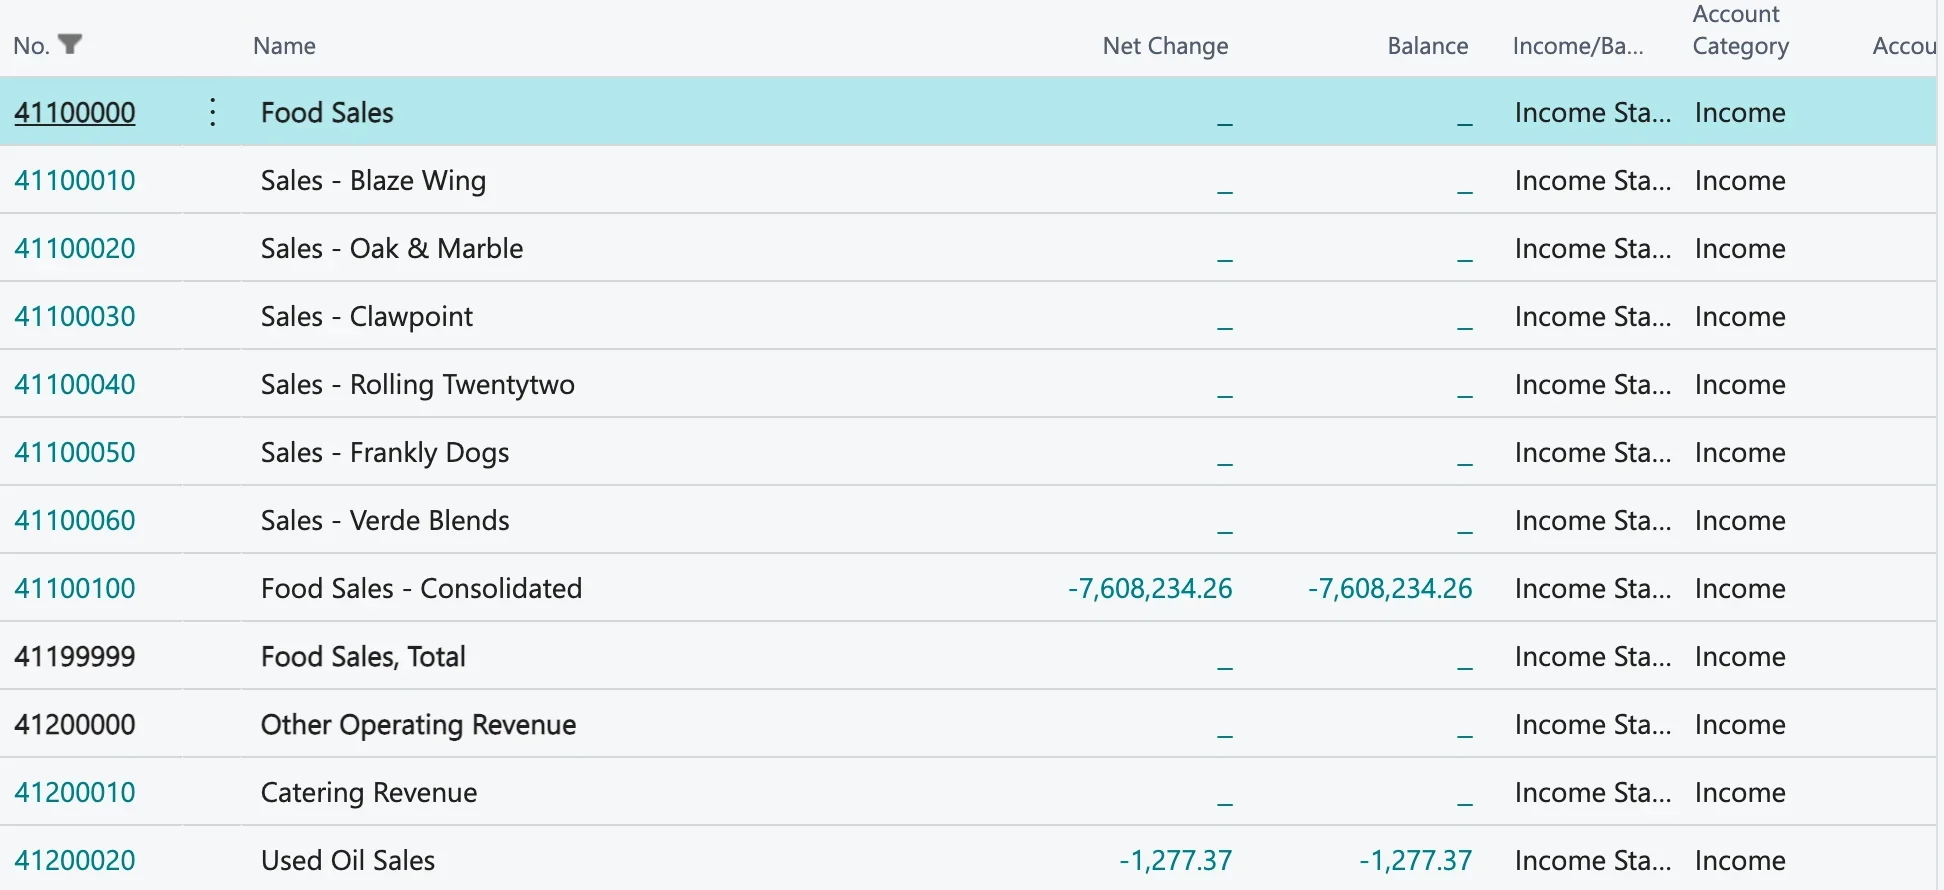
Karim's route is the long one, and the difference lives on it. He filtered the chart of accounts to the revenue range and found an account for every brand: Sales - Blaze Wing, Sales - Oak & Marble, Sales - Clawpoint, and one for each of the rest. All six were empty. Every dirham of food sales posts to a single account, 41100100 Food Sales - Consolidated, at −7,608,234.26. Brand was being recorded some other way.
The standard page for slicing the ledger by such a label, G/L Balance by Dimension, offers three choices for its rows and brand is not one of them. Karim built an Analysis View instead, a stored summary of the ledger that Business Central can pivot by brand, and ran it. His first matrix came back roughly 4.5 times too low on every brand, because with no account filter the view had netted revenue against cost, and no single brand figure looked wrong enough to give it away. He applied the revenue range 41100000..41999999 and the six brands matched Amira's exactly.
The totals still did not.
Both schedules were right, and only one of them showed the gap
The seventh row, Unallocated in Lens, is revenue posted with no BRAND dimension on the line at all. Somebody posted sales without filling in the brand, and Business Central allowed it, because nothing at Ember & Oud forces that field. Lens shows that revenue by default, as a row of its own, because it reads the ledger and the ledger has it. A dimension matrix has no row for it, because a matrix pivots on the brand values that exist, and a missing value is not one of them.
Amira’s schedule
It went in, with the seventh row labeled for what it is: AED 292,808.81 of revenue awaiting a brand.
Karim’s schedule
It answered "revenue by brand" and could not answer "all revenue". His follow-up was the coding: find the postings with the blank, assign the brand, and make BRAND a mandatory dimension on the revenue accounts so the row cannot grow back.
The mechanics
How the ledger hid a row, for whoever maintains it
Business Central can record which brand made a sale in one of two ways: give each brand its own revenue account, or post everything to one account and stamp each entry with a label that says which brand it belongs to. The six empty accounts settle which way Ember & Oud chose. Brand lives on the label. Business Central calls that label a dimension. Nothing in the chart is misconfigured; accounts answer what was sold, and dimensions answer who sold it and where.

G/L Balance by Dimension is the page built for this analysis, and its Show as Lines lookup offers exactly three choices: Business Unit, G/L Account, Period. BRAND is absent because of one screen in General Ledger Setup.
Business Central stores dimensions at three levels.
Global 1 and 2
Written onto every ledger entry as their own column, so they alone can serve as an axis on the standard pages.
Shortcut 3 to 8
Fields on document and journal lines, so a value can be filled in quickly at posting. Not carried as a column on the entry.
Everything else
Lives only in dimension set entries, a separate table holding each posting's full set of dimension values.
Ember & Oud has both Global Dimension codes blank, and BRAND is neither global nor shortcut, so it exists only in that table. Promoting it to global rewrites every entry in the company. That is a planned change, and not one made on a Thursday to answer one question.
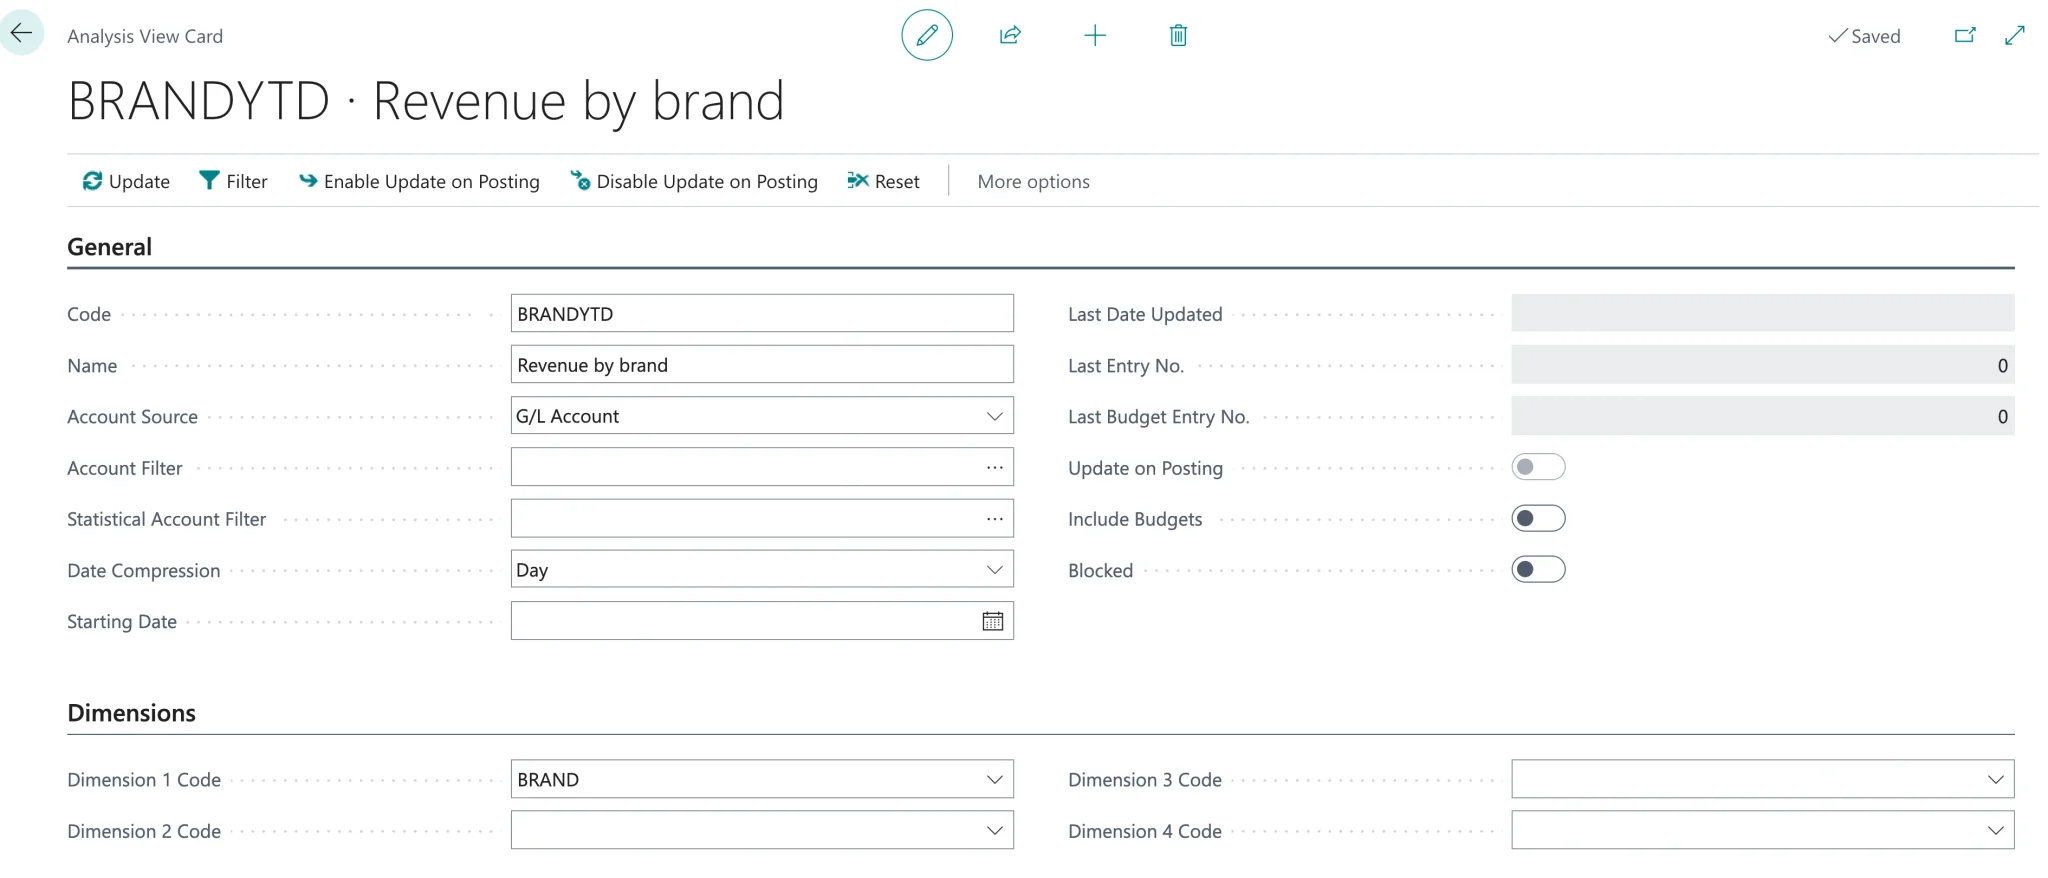
An Analysis View is a stored, precomputed summary of the ledger sliced by up to four dimensions named on its card. Karim created one: code BRANDYTD, Dimension 1 Code BRAND. Update walks the general ledger and materializes the result into Analysis View Entry rows. Three consequences follow.
- The view is stale until updated, unless Update on Posting is switched on.
- Date Compression is baked into the stored rows rather than applied at read time.
- The dimension list is fixed at creation.
The matrix page then set three traps.
- 1
The axis wants the code. Typing the description "Brand" into Show as Lines clears the field and leaves the placeholder behind; the field accepts BRAND.
- 2
Tab commits; Enter does not. Enter re-opens the lookup and discards the entry, and the matrix still renders the previous pivot without saying so.
- 3
Day compression means 59 columns. A two-month window came back one column per day, and the figure that matters, Total Amount, sits on the far left of the grid.
Account Source is G/L Account, and with Account Filter blank the view nets revenue against cost of goods and opex. The brand figures run roughly 4.5 times low, at no consistent ratio, between 4.38 and 4.68, so checking one brand against a half-remembered number does not catch it.
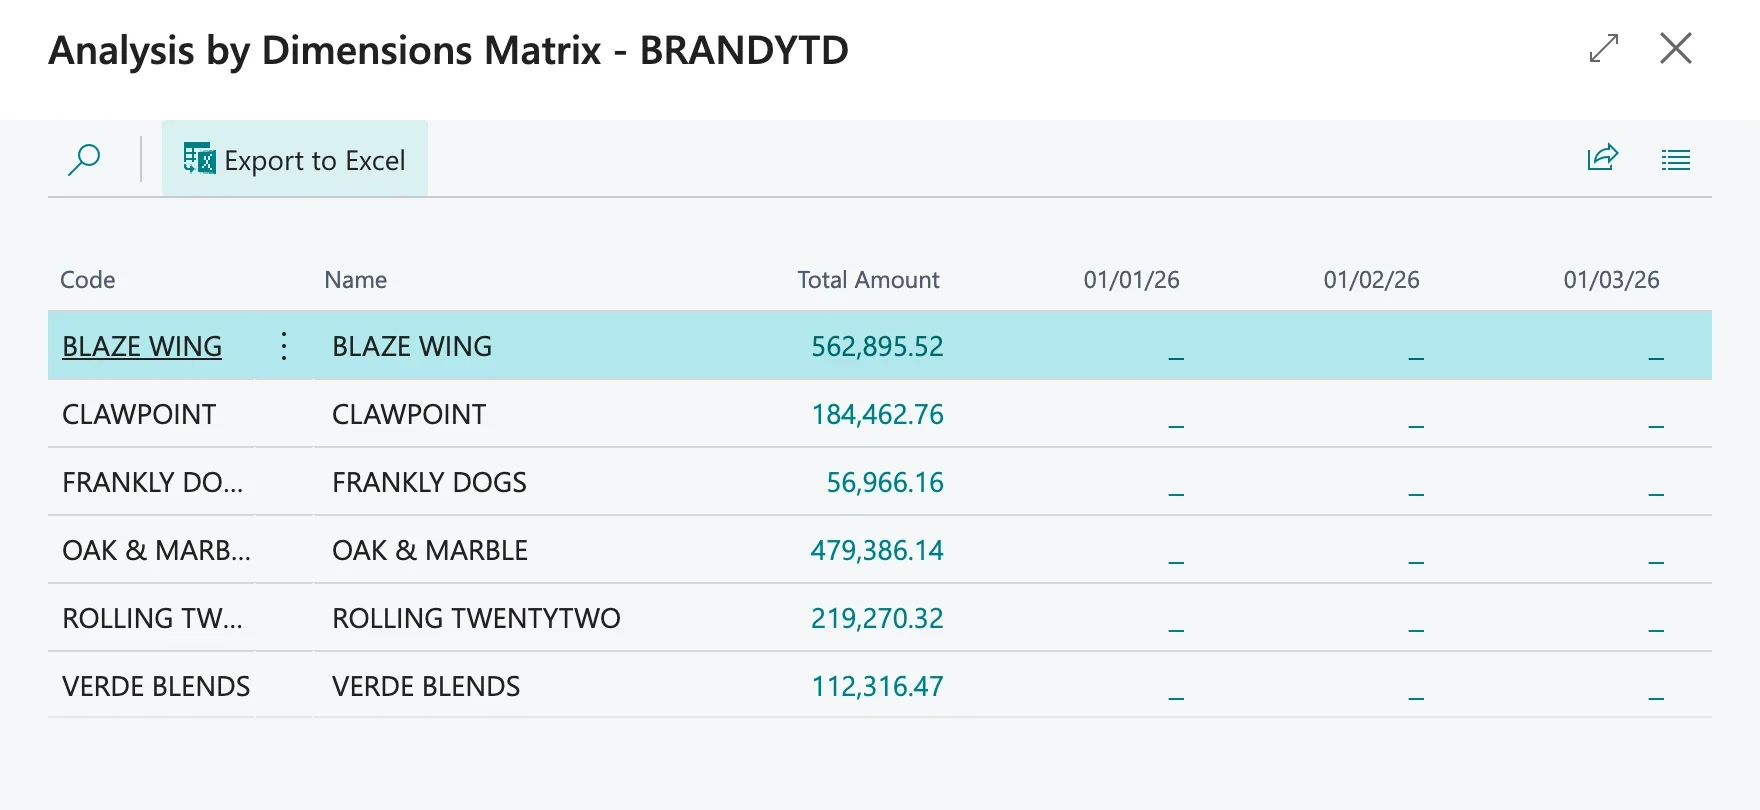
The filter that makes it revenue is 41100000..41999999, covering Food Sales, Other Operating Revenue and Sales Adjustments. Set on the matrix page rather than the card, it needs no second Update. Business Central reports revenue as credits, so the column comes back negative. With the range applied, Karim's six brands matched Amira's exactly. The totals still differed by AED 292,808.81.
The same sandbox, another question
The companion worked example picks up in February: a wall of green on the dashboard, a 453.5 point swing on a row that is not a brand, and four questions that end with Claude qualifying its own number on the MCP server.
Read the Investigate worked example →Download this worked example as a PDF (4 pages)
Book a thirty-minute guided demo and we will walk it end to end on the Ember & Oud sandbox. Book a demo
Secure and in your control
Sign in with Microsoft·Read-only, never writes to Business Central·Strict tenant-level data isolation, on Azure·Synced daily and on demand, unlimited users
Ember & Oud is an invented company. Figures are illustrative.