
Worked example · Investigate and Claude on MCP
February was the best month on record. Then she ranked every restaurant by margin.
By Avradip Mandal·
Ember & Oud is an invented restaurant group with a realistic ledger, so the mechanics are real and the books are nobody's. Every figure is illustrative.
Ember & Oud runs six brands out of a single central kitchen. Oak & Marble is the premium grill, earning 84 fils of gross margin on every dirham it takes. Blaze Wing is the volume business. Clawpoint, Rolling Twentytwo, Frankly Dogs and Verde Blends fill out the portfolio. Fourteen restaurants, one finance team, all on Business Central. The mess is the kind every real business knows: DEWA utility bills and mall service charges, four restaurants opened in a single month, a bucket of costs nobody has assigned to a restaurant yet. On March 3, with February finally closed, Amira, the group's finance lead, opened Lens expecting a routine read.
Read the transcript
February was the best month Ember and Oud ever had. Then the finance lead asked to see every restaurant ranked by margin.
First, plainly: Ember and Oud is not a real company. It is the sandbox we use to demonstrate Lens. An invented restaurant group with a realistic ledger, so we can show a real investigation without showing you somebody else's books.
Six brands, fourteen restaurants, one commissary kitchen, all of it in Business Central. On March third, Amira, the group's finance lead, opened Lens expecting a routine read. Revenue up fifty-nine percent. Margin up one point six. A screen full of green.
Two rows stopped her. Verde Blends, the only brand in red. And Unallocated, which is cost nobody has assigned to a restaurant yet, showing the biggest green number on the screen. If a residue can swing four hundred fifty-three points, how much of this green is real?
She did not build a report. She opened the Investigate tab and asked: Rank all outlets by gross margin for February 2026. Lens computed the ranking on the spot, every restaurant plus the Unallocated bucket. Verde Blends' two restaurants came out next to each other, ten points apart. Same menu, same kitchen, same suppliers.
Then she asked: Compare VRD0001 and VRD0002 for February 2026, revenue, COGS and gross margin. Straight from the restaurant P and L, reconciled to the dashboard. The two sell within eight percent of each other, so the whole gap is food cost.
Investigate had done its job, but her next questions were not lookups. So she opened Claude, connected to the same MCP server Lens runs on. She asked: Using the Zfense MCP for Ember and Oud: apply February 2026's brand-level gross margins to January's revenue mix. What would group gross margin have been, and how much of the actual decline is mix rather than trading?
The first thing Claude did was disagree with the question. As reported, margin had risen. Strip out the Unallocated bucket and it had fallen, and the fall was entirely mix. The headline had been flattered by a residue shrinking, not by restaurants cooking better.
Then she went back to VRD0002 and asked: Using ZfenseMCP for Ember and Oud: VRD0002 runs 10 points below VRD0001 on the same menu. Quantify the excess cost per month and annualized, and confirm whether it is food cost or overhead.
Claude confirmed the read. The whole ten points is cost of goods, not overhead. Held at its twin's food cost rate, VRD0002 was carrying seventeen thousand nine hundred dirhams of excess cost a month. About two hundred fifteen thousand a year.
Then, unprompted, Claude gave three reasons not to take that number to a board yet, each one checkable against the ledger. The first: VRD0002 had been open a single month, so treat the figure as a ceiling, not a run rate. A dashboard gives you answers. It does not tell you what they cannot support.
One afternoon. Four questions. No report built, and nobody waiting on a specialist. Everything you have just watched runs on our sandbox. Book a thirty-minute guided demo and we will walk it end to end.
Revenue had jumped 59% to AED 4.7 million, margin was up 1.6 points, EBITDA was nearly a million dirhams better than January, and every brand had grown by double digits. The screen was a wall of green, and every number on it was true.
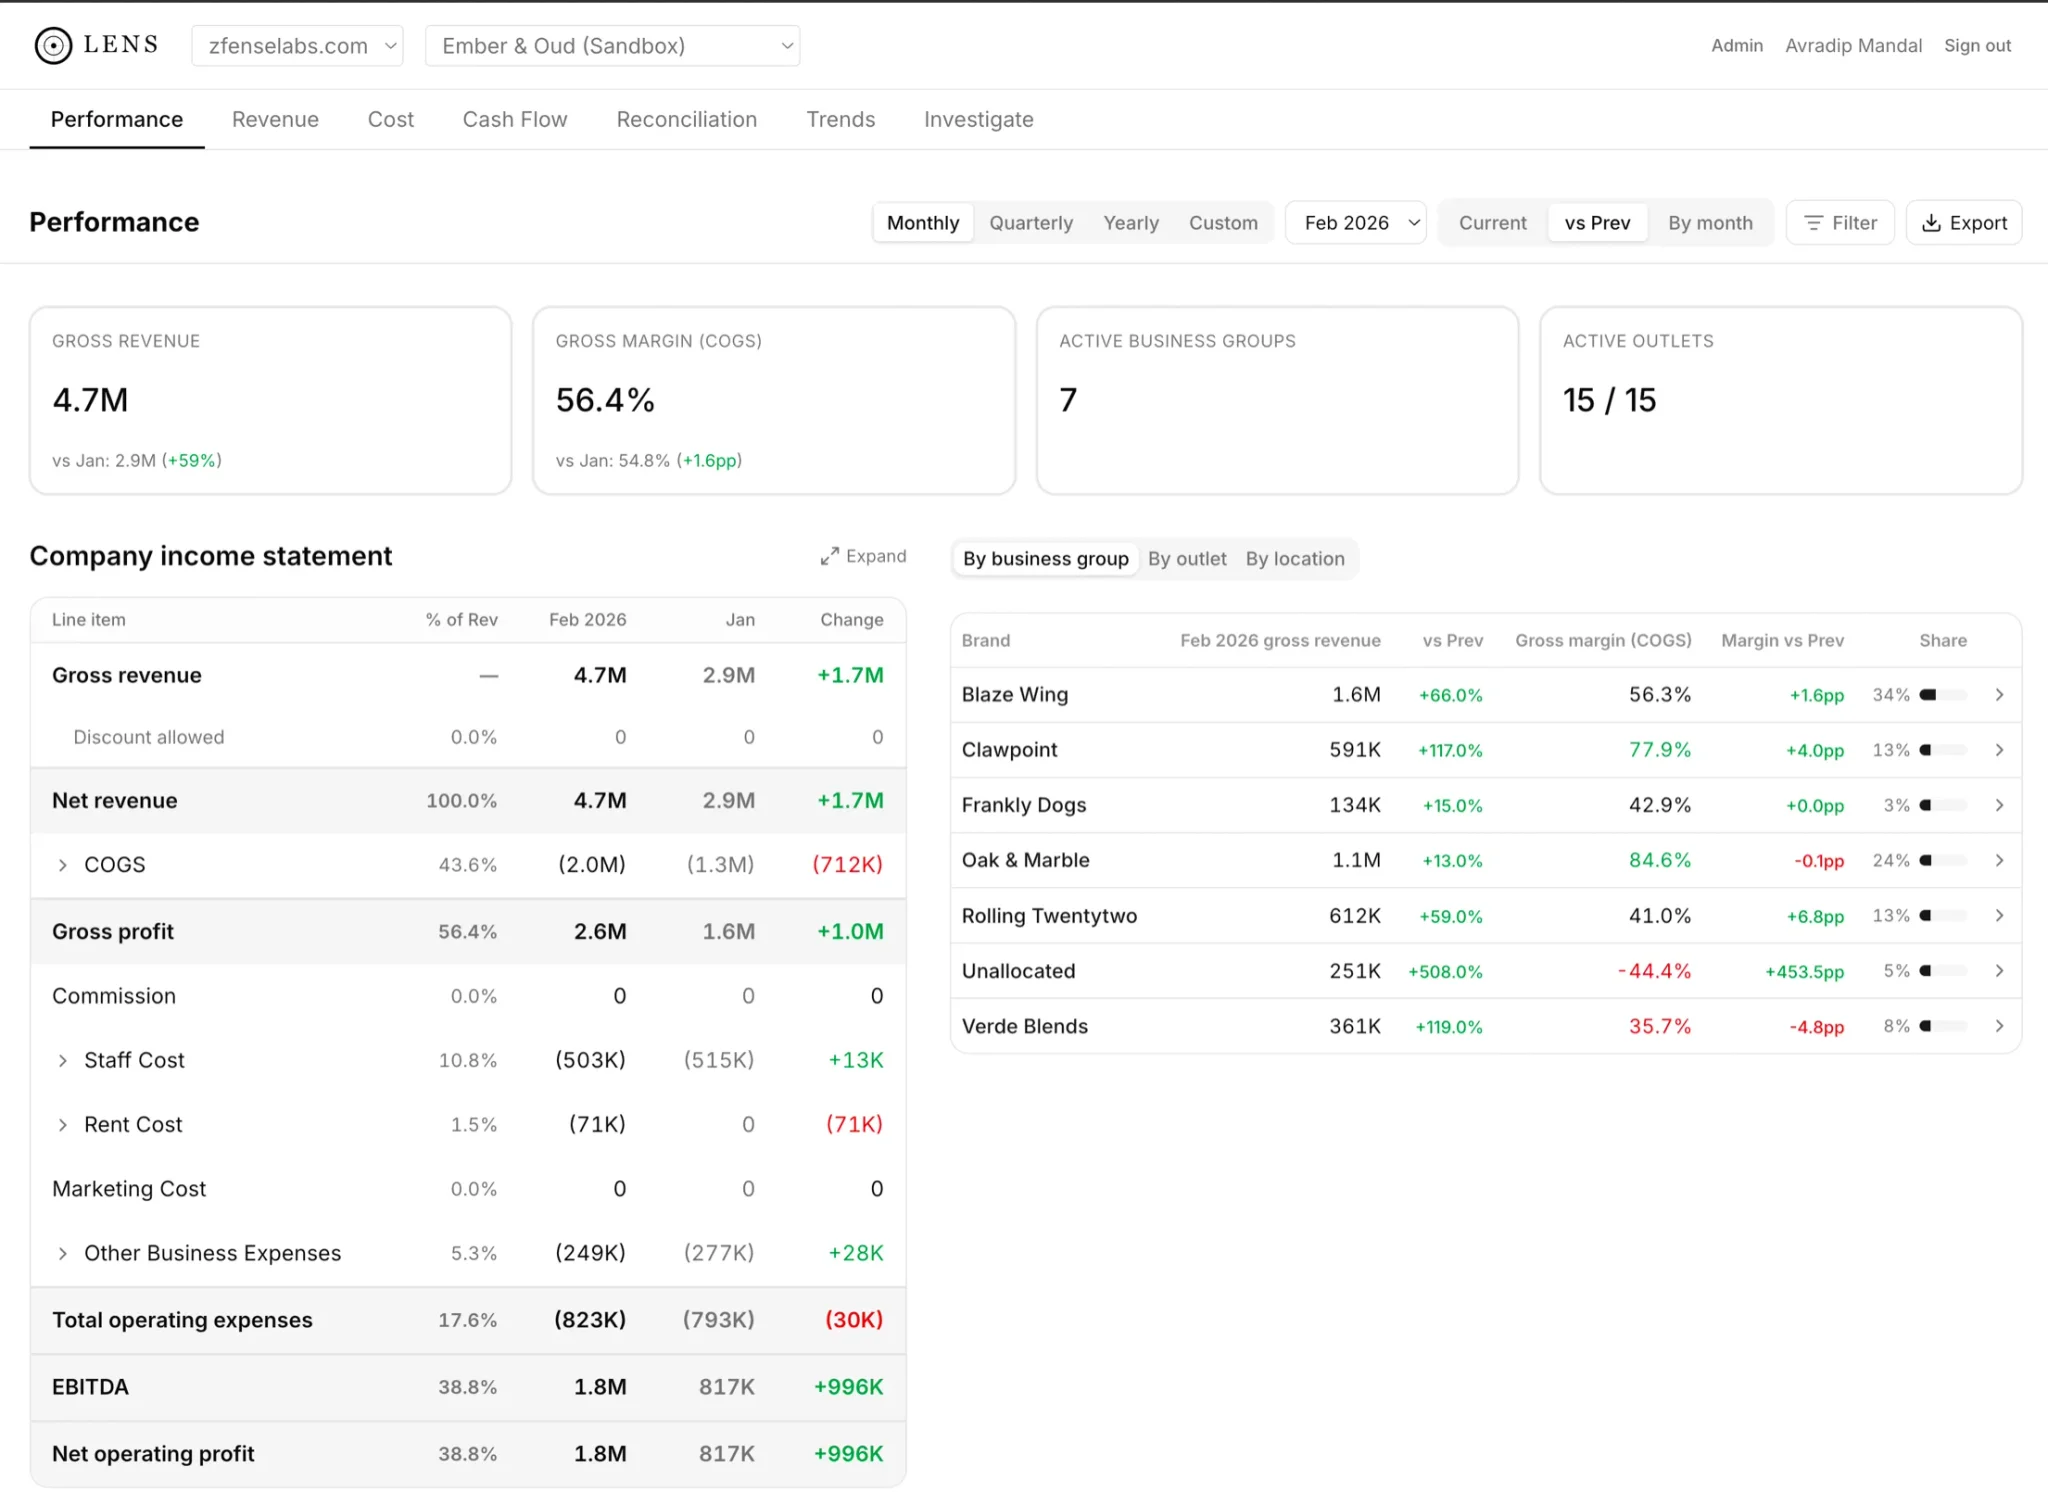
Two rows stopped her. Verde Blends was the only brand in red, but it had just opened its second restaurant, and new sites bleed margin for a while. The row above it was harder to explain. Unallocated is not a brand; it is cost that has not yet been assigned to any restaurant, sitting against a stub of revenue. It showed the largest green number on the screen, +453.5 points of gross margin month on month. An accounting residue does not improve by 453 points. It just gets less wrong.
She did not build any report, just asked four questions
Investigate · 1
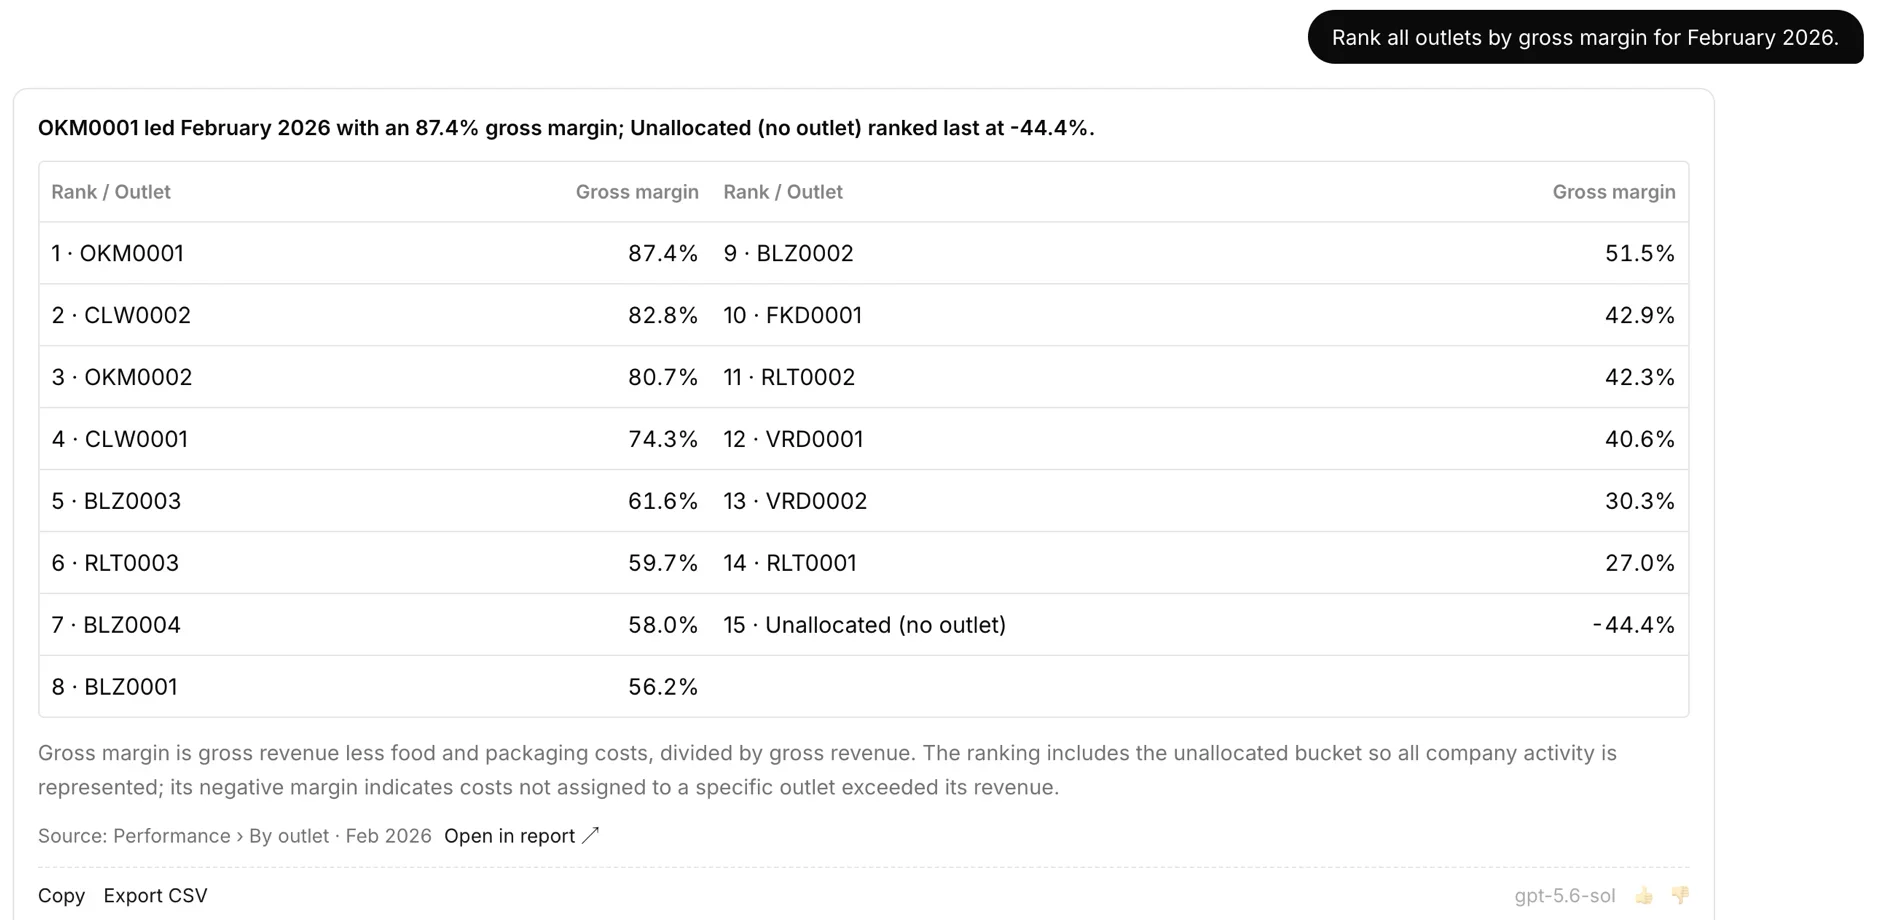
“Rank all outlets by gross margin for February 2026.”
She opened the Investigate tab and asked. Lens ranked all fourteen restaurants plus the Unallocated bucket on the spot, from OKM0001, an Oak & Marble grill, at 87.4% down to RLT0001, a Rolling Twentytwo site, at 27%. Verde Blends' two restaurants sat next to each other on the list, ten points apart: VRD0001 at 40.6% and VRD0002 at 30.3%. Same menu, same kitchen, same suppliers.
Investigate · 2
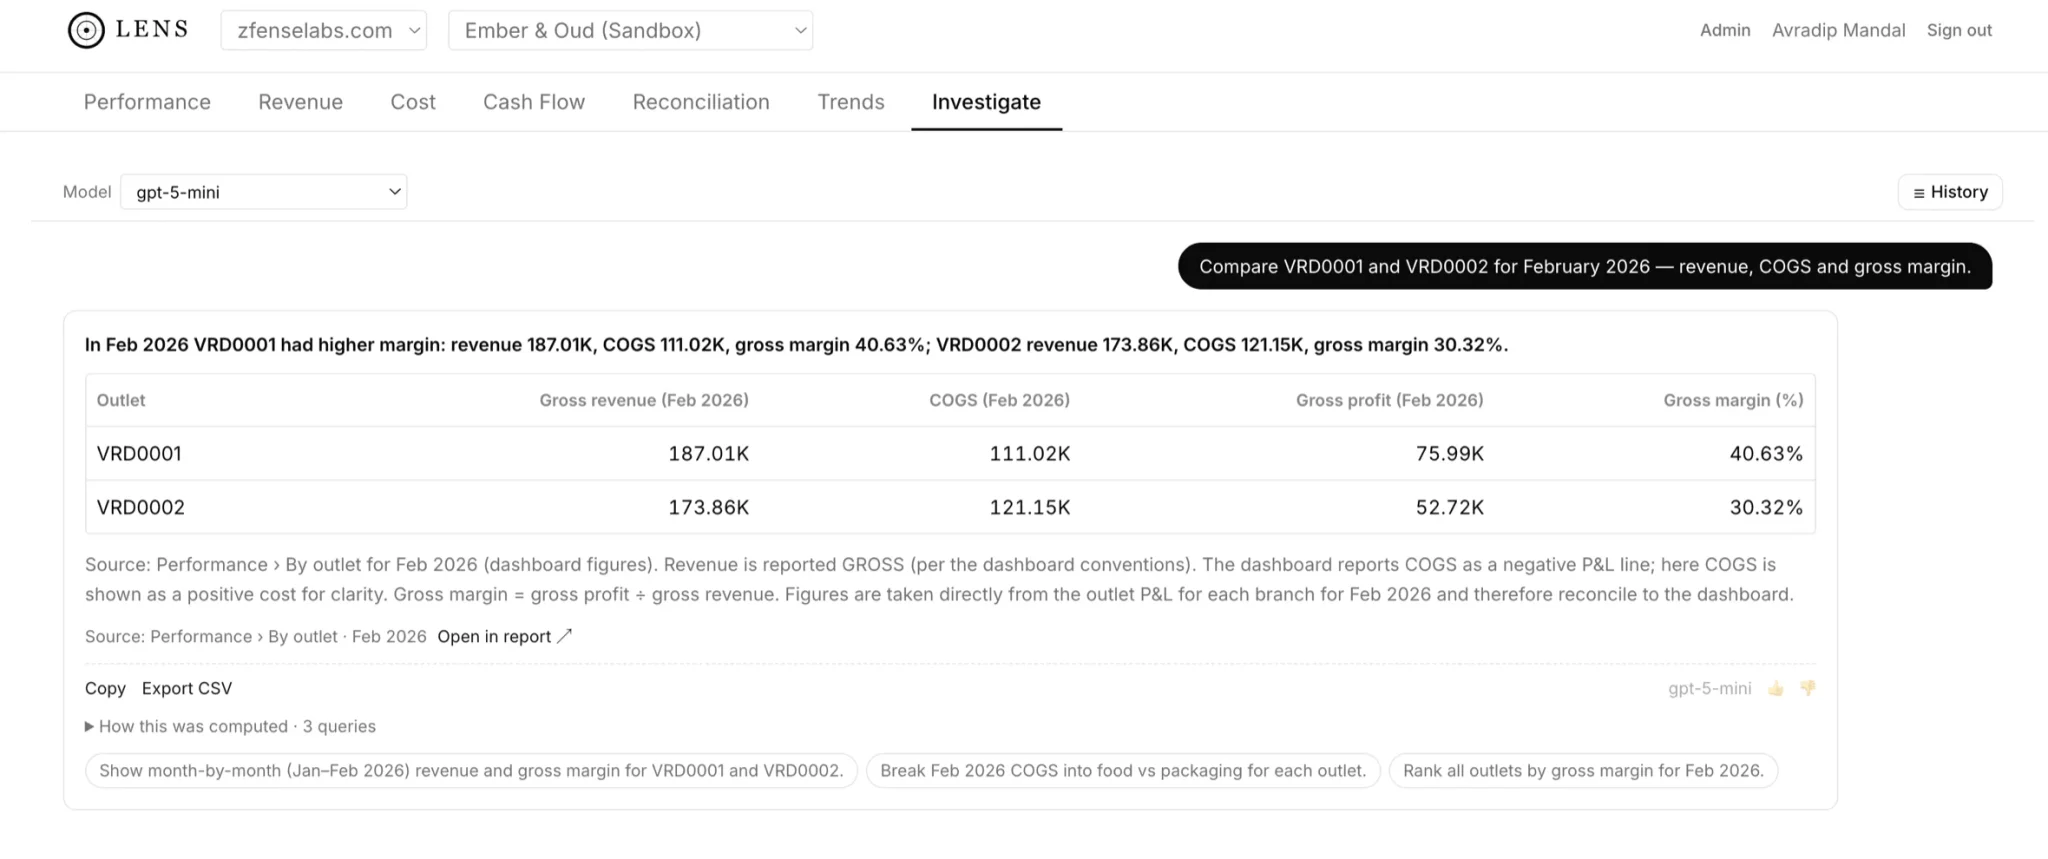
“Compare VRD0001 and VRD0002 for February 2026, revenue, COGS and gross margin.”
The answer came straight from the restaurant P&L and reconciled to the dashboard. The two sell within 8% of each other. COGS, the cost of the goods sold, was 111.02K against 121.15K, so the whole ten-point gap sits in cost of goods. At that point the questions stopped being lookups. She opened Claude, connected to the Zfense MCP server, which exposes the same warehouse Lens reads under the same access rules.
Claude · 3
“Using the Zfense MCP for Ember & Oud: apply February 2026's brand-level gross margins to January's revenue mix. What would group gross margin have been, and how much of the actual decline is mix rather than trading?”
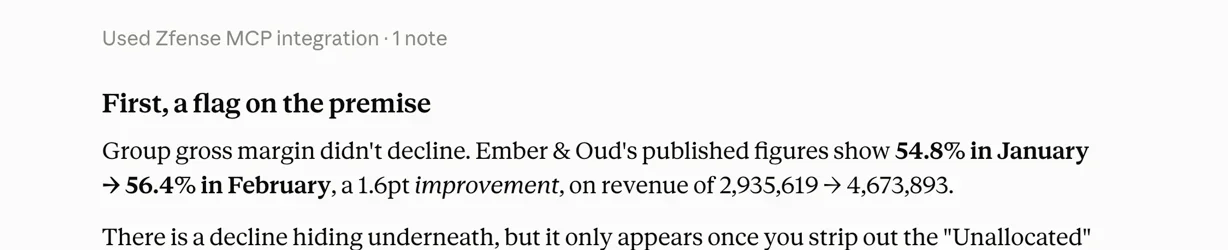
The first thing Claude did was disagree with the question. As reported, margin had risen 1.6 points. Excluding Unallocated, group margin went from 62.8% in January to 62.2% in February. Trading, how well each restaurant cooked and sold, added 1.5 points. Mix, the share of revenue each brand contributed, took away 2.1. Oak & Marble fell from 34.2% to 25.3% of revenue, worth 1.8 points on its own; Verde Blends growing at 35.7% cost 0.7; Clawpoint gave back 0.5. The headline had been flattered by a shrinking residue rather than by restaurants cooking better.
Claude · 4
“Using ZfenseMCP for Ember & Oud: VRD0002 runs 10 points below VRD0001 on the same menu. Quantify the excess cost per month and annualized, and confirm whether it is food cost or overhead.”

Claude made ten tool calls against the ledger and named the company before answering. The whole ten points is cost of goods, not overhead. Held at VRD0001's food-cost rate, VRD0002 carried AED 17,929 of excess cost a month, about AED 215,000 a year. The EBITDA gap matched the COGS gap to the second decimal.
Claude then gave three reasons not to take its own number to a board
Unprompted, Claude listed three reasons not to carry AED 215,000 a year into a boardroom yet, each one checkable against the ledger. A dashboard produces answers. It does not say what those answers can bear.
It rests on a single first month
VRD0002 opened on February 1 and posted nothing in January. Twenty-eight daily invoices confirm a full month, but opening waste, training batches, over-ordering and initial stock build routinely inflate a first month's cost of goods by this much, and opening inventory may have been expensed rather than capitalized. Treat 215,000 as a ceiling, not a run rate, until March closes.
Food cost cannot be narrowed further
COGS posts to a single account, 51100100 COGS - Consolidated. The P&L lists food and packaging separately, but the ledger has no split, so nobody can yet say whether the gap is yield, portioning, waste or packaging. The purchase and stock-count lines behind that account are what to pull next.
Overhead is exonerated by construction
Opex, the operating expenses below gross margin, lands at exactly 18.60% of revenue for every restaurant: a pro-rata allocation of a central pool rather than spending recorded restaurant by restaurant. Overhead cannot differ between two restaurants in this dataset. The finding is that the gap is in COGS, which is a narrower claim than saying VRD0002's overhead is fine.
It took one afternoon and four questions, with no report built and nobody waiting on a specialist. Amira took the ten points to the board and left the AED 215,000 at home.
The mechanics
Moving from the dashboard to Claude changed the questions, and nothing else
Investigate is the natural-language tab in Lens. It answers ranking and comparison questions directly from the Business Central ledger, reconciles each answer to the dashboard, and shows the queries behind it. Two of Amira's four questions never needed more than that.
When questions stop being lookups, Claude or ChatGPT connect through the Zfense MCP server. MCP is an open standard that lets an assistant call a set of named tools over a governed connection. The Zfense server offers 19 governed tools against the same warehouse, the copy of the ledger Lens reads, with the same conventions and the same access grants as the dashboard, so a branch manager's assistant sees their branch and nothing else. Lens signs in with Microsoft, is read-only, and never writes back to Business Central.
The same sandbox, the same close
The companion worked example is a reconciliation: two people answer the same diligence question from the same ledger, agree on all six brands exactly, and still disagree on the total by AED 292,808.81.
Read the Reconciliation worked example →Download this worked example as a PDF (4 pages)
Book a thirty-minute guided demo and we will walk it end to end on the Ember & Oud sandbox. Book a demo
Secure and in your control
Sign in with Microsoft·Read-only, never writes to Business Central·Strict tenant-level data isolation, on Azure·Synced daily and on demand, unlimited users
Ember & Oud is an invented company. Figures are illustrative.